Scan the RSI on MT4 with alerts
The relative strength index (aka RSI) is one of the most used indicators, it tells us if the asset is overbought or oversold. So it's very useful to scan the entire market to immediately see which symbols are overbought or oversold. We see how to achieve this on MT4 sending alerts notifications.

What is it? Why?
Relative strength index (RSI) is one of the most used indicators in trading, not only forex and not only MT4/MT5. It's an index (0-100) that tells us if an asset is overbought or oversold. To learn more, we suggest reading Investopedia relative strength index article.
Commonly these two values are used:
- RSI > 70: overbought
- RSI < 30: oversold
And the standard period used to calculate it is 14.
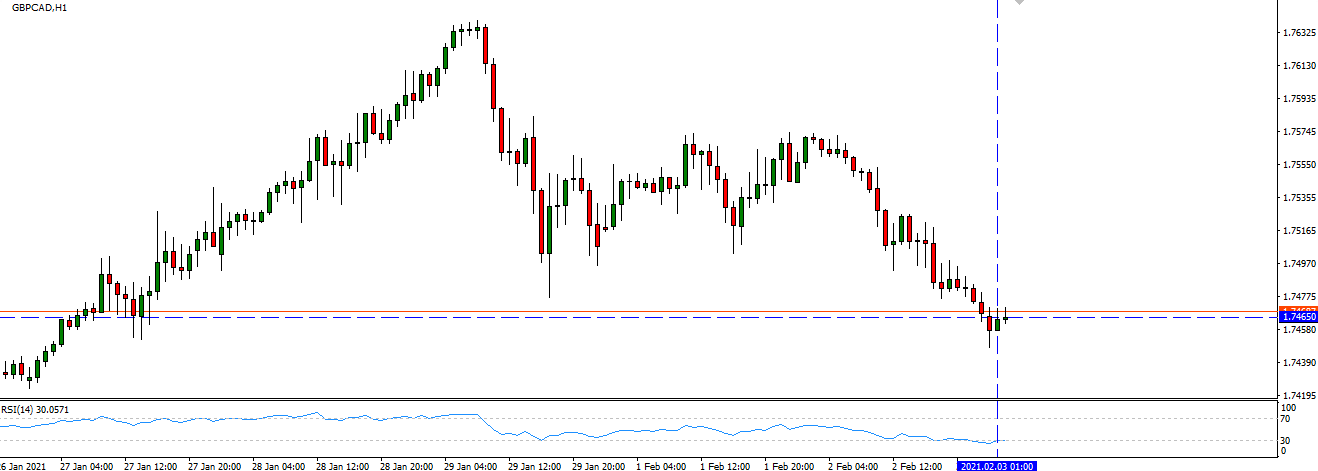
Common strategies are based on trend reversal; when the asset is oversold, we expect an uptrend; when it is overbought, we expect a downtrend.
How to automatically scan the RSI?
You can do it with a market scanner, a tool that allows you to scan the market using different indicators. Also, check for the RSI and without any programming skills, just a few clicks.
Once configured your rules (what you want to scan), the market scanner automatically scans all symbols and all timeframes you wish in order to look for your rules. The scanning results can be shown as different colors in a table to understand the overall situation immediately. Columns are the timeframes, and rows are the symbols, so every cell is colored according to the rule for that timeframe and that symbol.
And not only this, it can send you an alert on your mobile phone when there is a change.
How does market scanner for relative strength index work?
We have three different situations:
- RSI >= 70: overbought
- 30 < RSI < 70: no oversold/overbought
- RSI <= 30: oversold
So if we want to apply trend reversal strategies, we could have the following colors:
- RSI >= 70: red, since we expected a trend reversal and we want to go short
- 30 < RSI < 70: yellow, since we do not expect a trend reversal
- RSI <= 30: green, since we expected a trend reversal and we want to go long
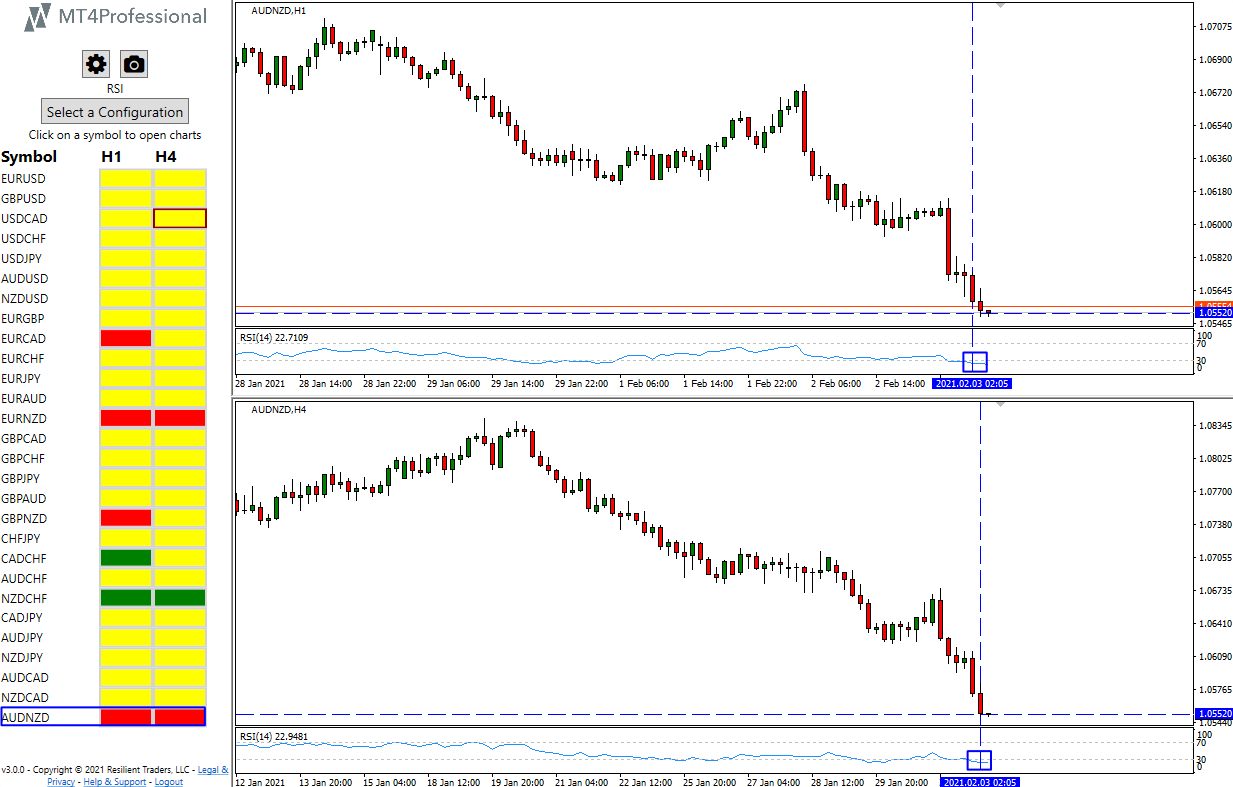
So our scanner will look like the following one; of course, we use the standard 14 period.
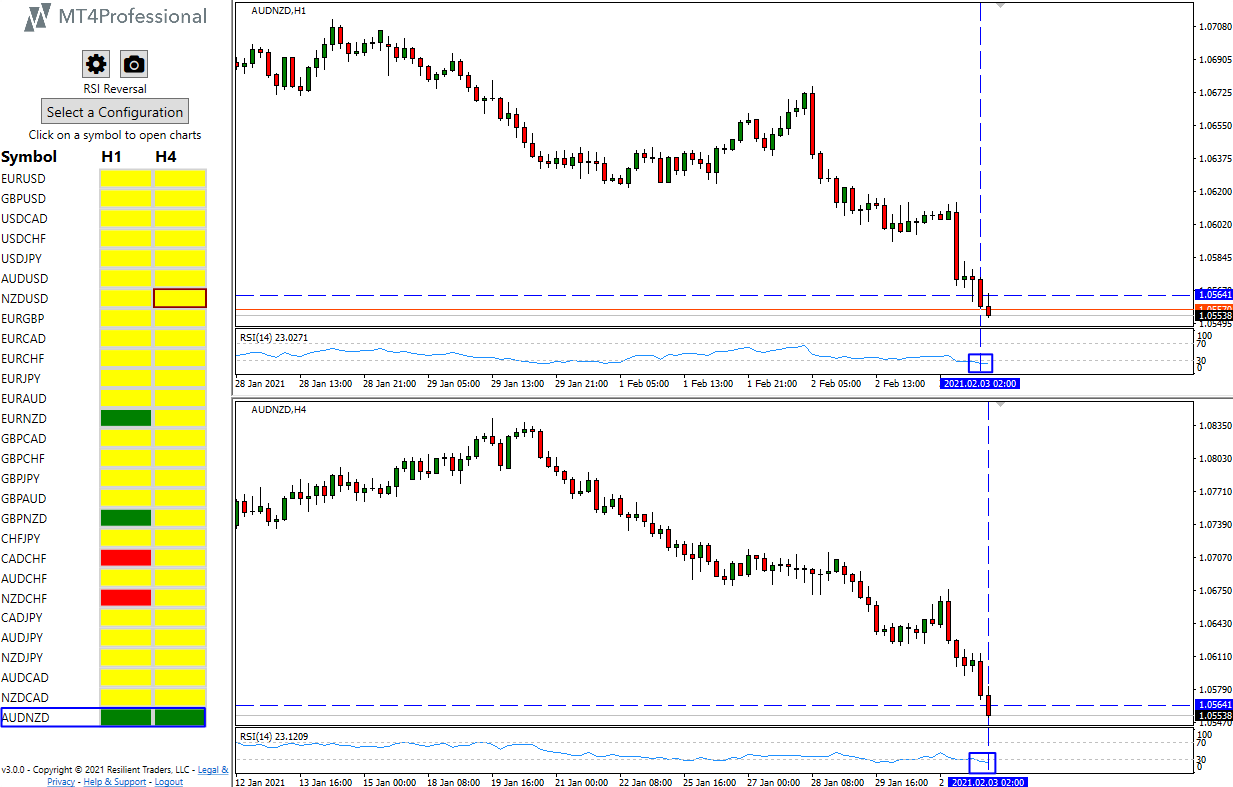
Looking at the previous image, we see for AUDNZD that it's oversold for both timeframes (H1 and H4), and we expect a trend reversal, an uptrend.
We can see there are a lot of yellow, so situations where there is no oversold/overbought, this allows us to immediately spot all symbols where there is oversold/overbought since they are colored.
How to configure the market scanner?
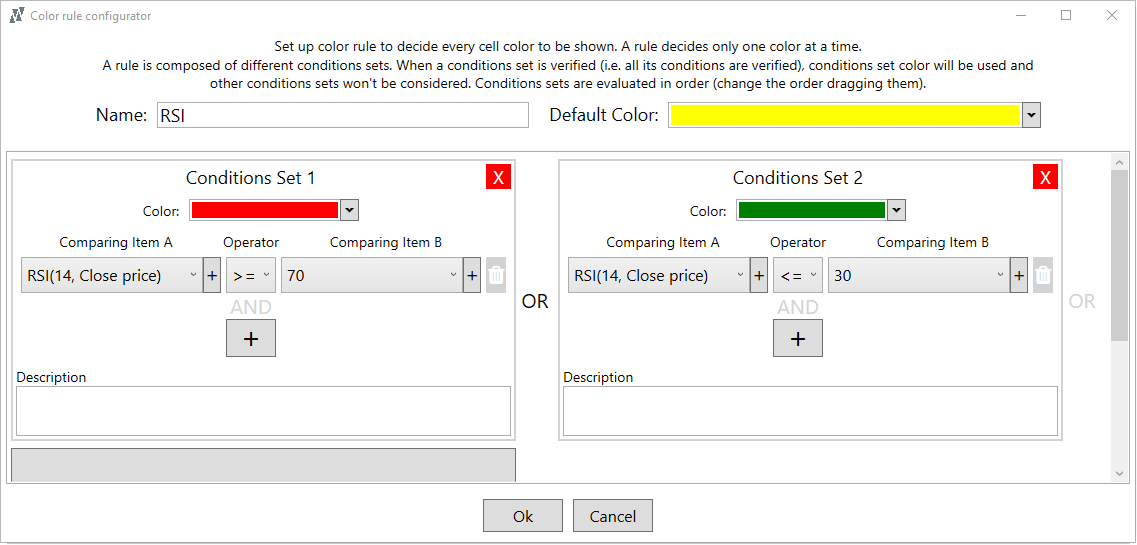
It's effortless, we just put rules as previously described in words, setting the color we want to see, so we set the following rules:
- If RSI >= 70: red
- If RSI <= 30: green
- Otherwise (default): yellow
We have to do only this, only specify our scanner rule, then the scanner automatically will apply this rule for symbols and timeframes defined.
Note: the scanner allows us to configure a default value to be used when conditions are not verified, so in your case when 30 < RSI < 70.
No trend reversal, simple view
If we only want to see if the price is overbought or oversold, without applying trend reversal strategies, we want to immediately see typical colors for sold/bought having the following situation:
- RSI >= 70: green
- 30 < RSI < 70: yellow
- RSI <= 30: red
The other things are kept in the same way; we still use standard 14 period. So the result is just the same with opposite colors for red/green: where we have green, we have red and vice-versa, but yellows remain the same.
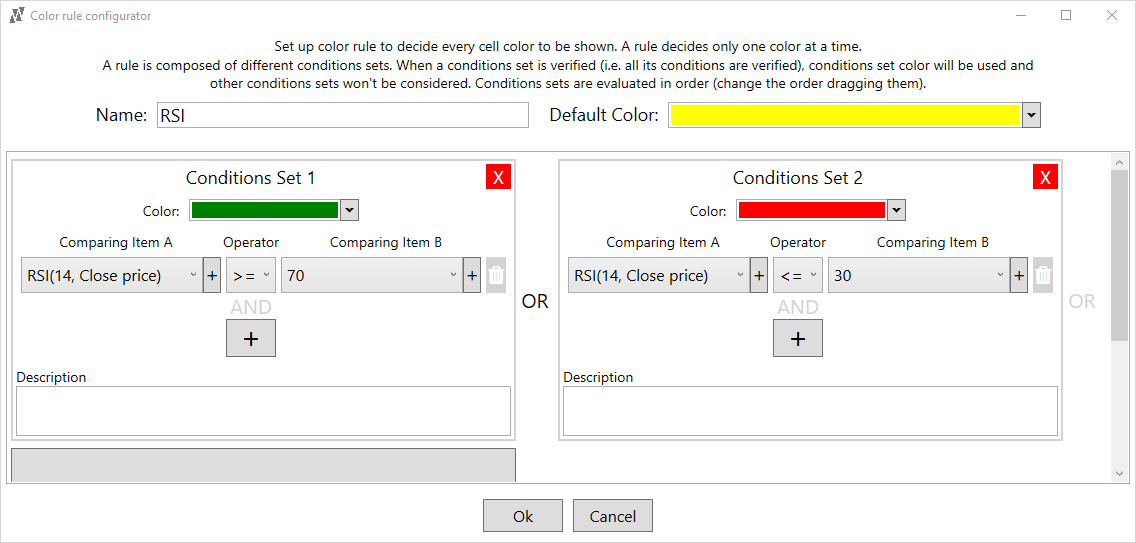
The scanner rules are analogous to the previous example:
- If RSI >= 70: green
- If RSI <= 30: red
- otherwise (default): yellow
Alerts Notifications
We previously said a market scanner allows you to send an alert on your mobile phone.
In case of relative strength index having alerts notifications are useful since you could be alerted when a symbol exit from the yellow zone and enter in red/green (overbought/oversold) zone.
This gives you the possibility to immediately start analyzing the chart manually and with other instruments only when there is a high probability of trend reversal. And this without losing time before when this cannot occur.
Conclusion
We have seen how easy it is to scan the RSI using a market scanner.
However, some years ago, we looked for a market scanner on MT4/MT5, since we are traders, but we didn't find it. So we decided to create MT4Professional, the #1 market scanner on MT4.
MT4Professional has full market scanner capabilities with alerts notifications. Still, not only this, but it also has other useful features to help you refine opportunities identified via the scanner, such as open symbols charts in one click or multi-timeframe analysis via synced crosshair.
Do you want to start with the two examples shown before?
MT4Professional has many scanner examples included, and some of them are the two relative strength index examples shown before.
If you want to start now to scan the RSI on MT4/MT5 you can try MT4Professional for FREE.