What is Moving Average in forex trading? On MT4?
If you have been looking into forex trading, you must have come across the term Moving Average quite often. Forex traders keep a keen eye on the Moving Average or MA to determine the market condition. But what exactly is the Moving Average in forex trading? Let’s find out.

The stock market is a tricky place. There are both risks and rewards involved, but the risks often hold people back from venturing into forex trading. There is a common misconception that investing in stocks is the same as gambling. What most people don't know is that once you understand the way the stock market functions, it is very much like any other investment with a chance of greater returns.
Investing in stock helps your money grow with the economy. But at the same time, it also helps you stay ahead of inflation as the average annual returns of stocks are much higher than average annual inflation rates. The forex market has the highest liquidity as the daily trading volumes here are the largest. There are many reasons to start your journey in forex trading, but before you begin, it is essential to have a thorough knowledge of the market and the risk-return relationships.
What is a Moving Average?
A Moving Average is a stock indicator used in technical analysis. The MA represents the average closing price of the market over a specific duration. This could be 50 days, 100 days, or 200 days. Traders often use the Moving Average as an effective indication of the current market momentum. The Moving Average calculation helps mitigate the impacts of random, sudden fluctuations on the price of a stock over the specified time.
Two Moving Averages are most commonly used. These are the Simple Moving Average (SMA) and the Exponential Moving Average (EMA). The SMA is calculated taking the arithmetic mean of a given set of stock prices over a specified time, say the past 15, 30, 100, or 200 days.
On the other hand, the EMA is calculated, giving more importance to the price of a stock over more recent days. Thus, it is a weighted average that provides a more accurate indication based on new information.
How is the Moving Average used in Forex?
As a technical analysis tool, the moving average is used to identify a given stock's trend direction. The MA can also help determine its support and resistance level. Since it is based on past stock prices, it can also be considered a lagging indicator. The longer the time period over which the Moving Average is calculated, the more will be the lag. This means a 200-day or a 100-day Moving Average will have a much more significant lag than a 20-day Moving Average, as they are based on prices of the past 100 or 200 days.
So, the shorter the time span over which the Moving Average is calculated, the more sensitive it will be to stock price changes. Whereas if the time span is longer, it will be less sensitive to changes. The most preferred MAs that traders use in general are the 50-day and the 200-day Moving Average. However, investors can choose for themselves whichever timeframe they find suitable. Their trading objectives usually decide it. An investor may also choose different timeframes of varying lengths to calculate their Moving Averages. For instance, short-term trading uses a shorter time frame for calculating MAs, whereas long-term trading will require longer time frames for the Moving Average.
There is no hard and fast rule as to which timeframe is best for calculating the Moving Average. It boils down to the trader's individual choice and has to be found out through experimentation and trial to see which one fits the trading strategy best.
Moving Average trends
The Moving Average, being dependent on the stock prices, will keep changing for every given timeframe that you consider. If the Moving Average is constantly rising, it indicates that there is an uptrend in security. In contrast, a drop in the Moving Average indicates a downtrend.
Moreover, to confirm the upward momentum, a bullish crossover may be seen. That is when a short-term MA crosses over a long-term MA. On the other hand, a bearish crossover confirms the downward momentum when a short-term Moving Average crosses below a long-term MA.
In simple terms, when the stock prices are trending higher, the Moving Average will adjust itself and move higher as well. This can be considered an excellent time to buy as the stock shows promise, and the upward trend is predicted to continue.
Similarly, when the price of a stock is continuously dropping, as indicated by the Moving Average, traders prefer to sell those stocks as the downward trend is expected to continue.
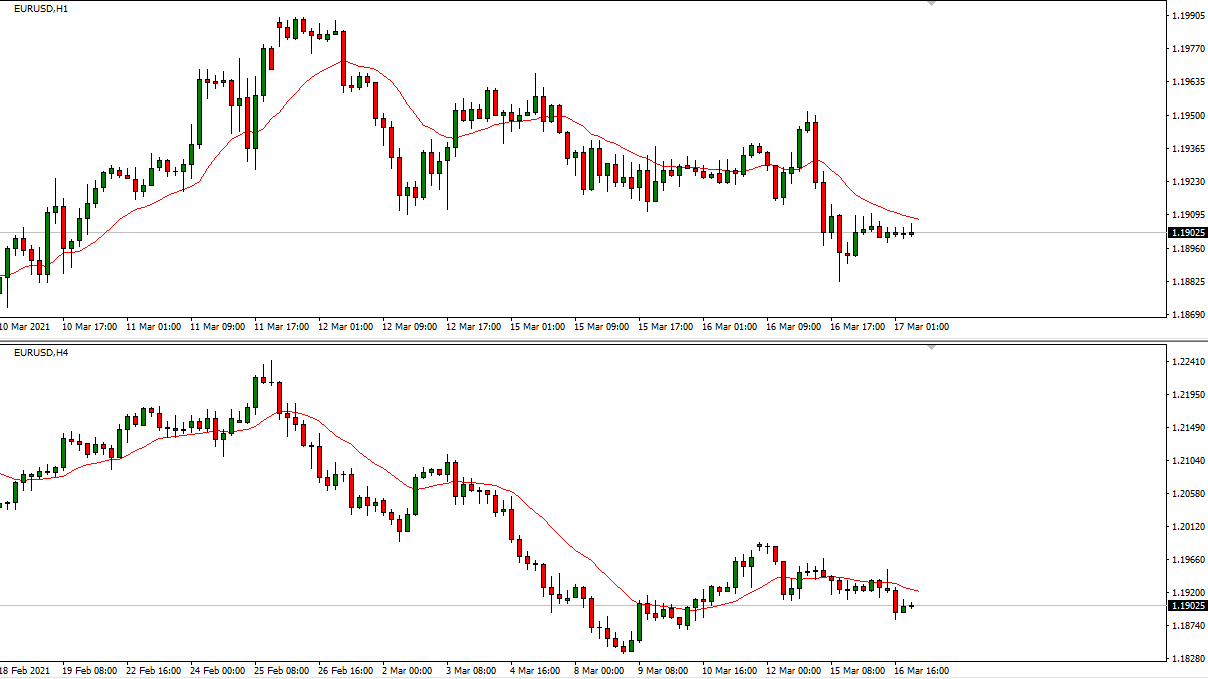
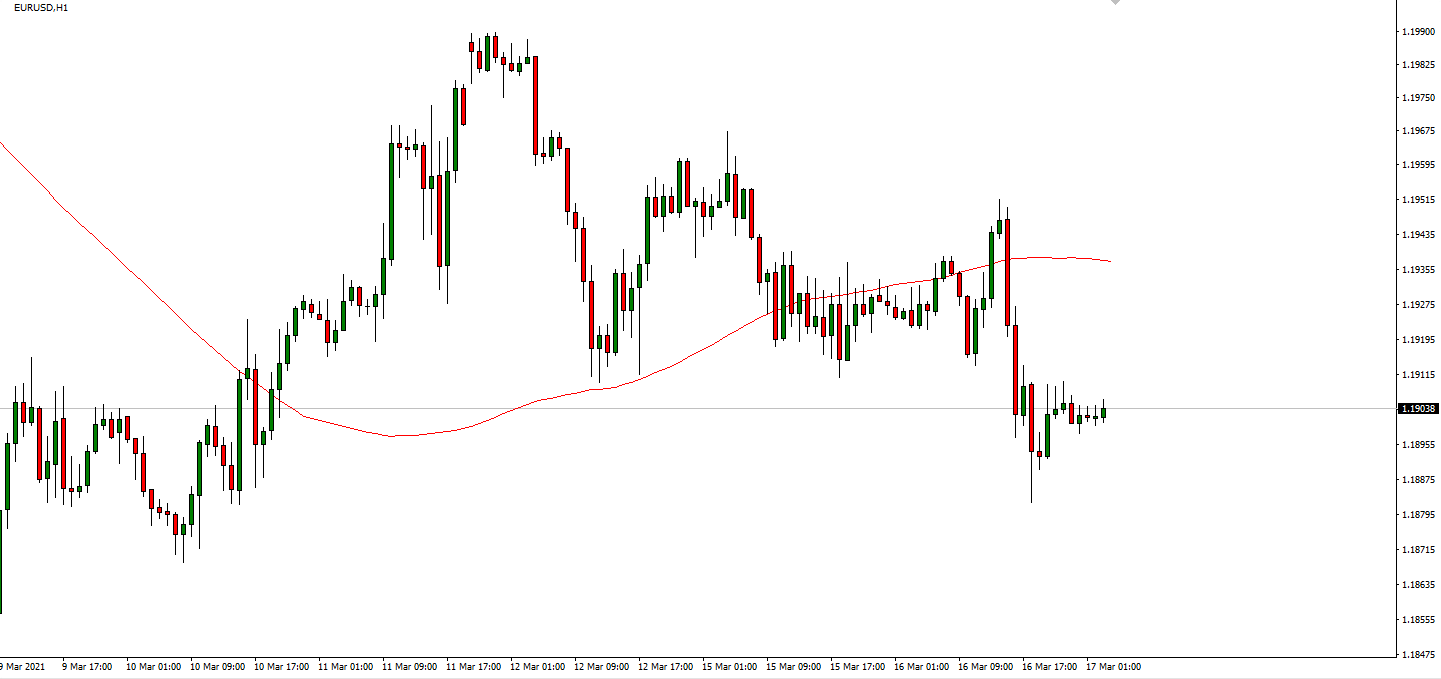
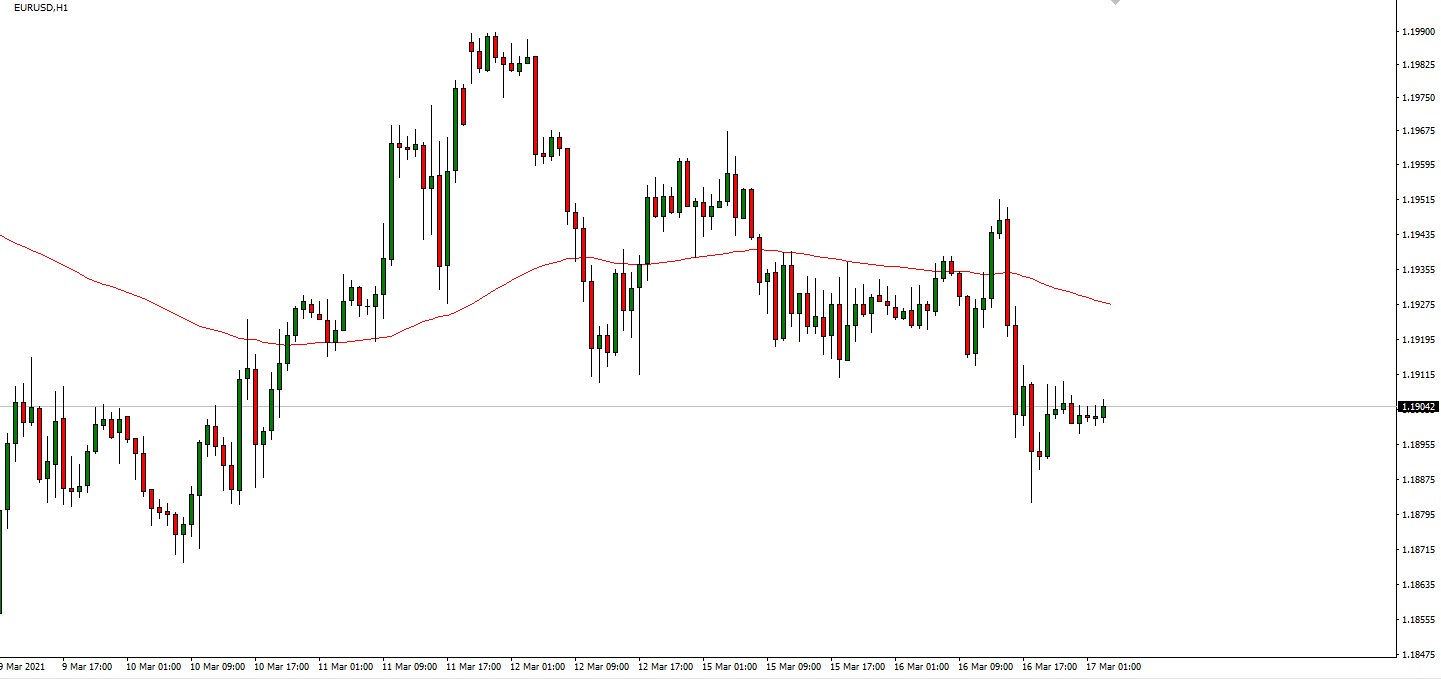
It is essential to know how the Moving Average or a crossover can be identified on MT4 or MT5.
What is MT4?
MT4 or Meta Trader 4 is a trading platform that MetaQuotes developed in 2005. It is mainly associated with forex trading but can be used to trade a wide range of markets, including cryptocurrencies, commodities, and indices.
The MT4 platform is highly customizable based on the trader's individual preferences. It can also be used to automate trading to open and close trades on your behalf, using algorithms that work based on a list of set parameters.
Following the success of the MT4, MetaQuotes also launched the MetaTrader 5 or MT5 platform that has an even more extensive suite of trading tools. The MT5 is meant for advanced traders.
Using the Moving Average indicator on MT4
The Moving Average indicator comes as a core tool with the MT4 download. In the Moving Average indicator on the MT4 trend indicator menu, you can choose between simple, exponential, smoothed, and linear weighted MA. Once you have selected the MA type to track, you will need to select the parameters that will decide how the Moving Average will be calculated and how it will be represented.
So, there are two categories of parameters to choose from – Calculation parameters and Visual parameters. The Calculation parameters include the period over which you would like to calculate the Moving Average. The Visual parameters include things like how the indicator will be represented, the colors and thickness of the lines on the chart, etc. You can also change or delete the chosen parameters later if you need to.
Check out our article, Scan The Moving Average Cross On MT4 With Alerts, to learn more about observing Moving Average crossovers on MT4.
The purposes of different Moving Averages
The most commonly used Moving Averages by traders are 20 Period EMA, 5 EMA, 10 EMA, 21 EMA, 50 SMA, 100 SMA, and 200 SMA. The numbers here indicate the number of days over which the MA is calculated. Let us have a look at when and where these different Moving Averages are applied.
20-Period EMA
The 20-period EMA is particularly popular in day trading. And since the forex market makes day trading in small amounts easier, this MA is most commonly used by forex traders. In this analysis, a 20-period EMA is plotted on a 5-minute chart or a 15-minute chart to study the uptrend or downtrend over shorter durations within a day. This makes buying and selling decisions much easier in day trading.
There are also other day trading MAs like the 5-period EMA or a 200-period EMA. But longer durations can lag too much, not allowing day traders to be agile, while shorter ones behave almost like the price itself, not helping the analysis. So the 20-period is an intermediate choice.
5 EMA
The 5 EMA is useful for deciding when to enter and exit a trade. It is the closest average to the stock's actual price as it is both short-term and exponential. It is quite sensitive to price fluctuations and may not perform very well as a standalone indicator. But when used with another Moving Average such as a 50 SMA or a 100 SMA, it can show crossovers quite accurately and act as a powerful tool to help decide entry and exit timings.
10 EMA
This is also a short-term exponential MA and is thus considered to be a fast-moving average. It is generally used to define the direction of a short-term trend. It is mainly used by traders who need to track momentum-price crossovers. Like the 5 EMA, the 10 EMA can also reflect bigger trends when paired with other Moving Averages to show price crossovers. The 10 EMA is also used for determining stop-loss levels in short-term trading.
21 EMA
This Moving Average is relatively longer than the previous two. It is used in both short and intermediate-term trading. It works well as an independent indicator as well, showing price crossovers to determine trends. It can, however, be used with other Moving Averages such as the long-term SMAs. The 21 EMA filters out most of the market's noise and can be a great trading tool for deciding stop losses. It helps traders remain on the right side of the market.
50 SMA
Among all the Mas listed, the 50 SMA is the first trading tool for support and resistance. It can act as a support line for an uptrend and as a resistance line for a downtrend. It is also used along with the 5 EMA or the 10 EMA to confirm upward or downward momentum. Say if the price crosses above both the 5 EMA and the 50 SMA, it can be predicted to continue this upward trend for long. The 50/200 SMA crossover is also one of the most important long-term trend indicators used by traders.
100 SMA
This is a slow-moving average and can act as a support and resistance line between 50 and 200 SMA. For instance, if the price crosses the 50 SMA, then the following support line to look for is the 100 SMA. The 100 SMA is used both in long-term trading and in short-term trading with crossovers. It is also an important indicator to decide on trading pullbacks.
200 SMA
This is the longest duration that traders generally use and is the last level of support or resistance. It can be a useful indicator for deciding entry and exit timings in long-term trading. The 50/200 SMA crossover is considered the Golden Cross if it is bullish and the Death Cross if it is bearish. When a price reaches or crosses the 200 SMA, it is a clear indicator that the trends will change. The 200 SMA is, thus, used and highly respected by institutional traders.
Conclusion
For anyone who is even remotely interested in forex trading, knowing and understanding Moving Averages is a must. This is an essential tool that traders can use to make investment decisions, and only when you have complete knowledge of it will you be able to use it to your best advantage. Using the Moving Average indicator on your MT4 platform to help with decision-making can take your trading game through the roof.