Scan the MACD on MT4 with alerts
The moving average convergence divergence (aka MACD) is one of the most used indicators. However, there are different ways to use it (such as crossovers and divergences), so it's very useful to scan the entire market using MACD. We see how to achieve this on MT4 sending alerts notifications.

What is it? Why?
Moving average convergence divergence (MACD) is one of the most used indicators in trading, not only forex and not only MT4/MT5. It's a trend-following momentum indicator calculated subtracting two exponential moving averages. To learn more, we suggest reading Investopedia moving average convergence divergence article.
If you want to scan the moving average, read our scan the moving average article.
The moving average convergence divergence has three parameters:
- EMA 1 period, usually it's EMA(12)
- EMA 2 period, usually it's EMA(26)
- Signal EMA period, usually it's EMA(9)
The moving average convergence divergence result consists of 2 values:
- MACD itself: that is the first 2 EMA difference, so it's EMA(12) - EMA(26)
- Signal line: that is just the last EMA, so it's EMA(9)
Common strategies based on moving average convergence divergence that we'll analyze in this article are:
- Moving average convergence divergence zero crossover
- Moving average convergence divergence and Signal Line crossover
- Moving average convergence divergence rapid rises/falls
Moving average convergence divergence zero crossover
In this case, we want to check if the MACD changes from positive to negative and vice-versa, so if it crosses zero, this occurs when there is a trend reversal. If the MACD is above zero, there is an uptrend, vice-versa, a downtrend. However, this is less confirmation of its momentum compared to moving average convergence divergence and signal line crossover.
Moving average convergence divergence and Signal Line crossover
In this case, we want to check if the MACD crosses the signal line. This cross occurs when there is a trend reversal. If MACD is above the signal line crossover, there is an uptrend, vice-versa, a downtrend.
Moving average convergence divergence rapid rises/falls
In this case, we want to check if there are rapid rises/falls of MACD, which occur when the asset is oversold or overbought. Moreover, the MACD is used in combination with RSI (which also gives us overbought/oversold info). If you are interested in scan RSI read our scan the RSI article.
When the asset is oversold, we expect an uptrend. If it's overbought, the expectation is a downtrend.
How to automatically scan the moving average convergence divergence?
You can do it with a market scanner, a tool that allows you to scan the market using different indicators. Also, check for the moving average convergence divergence, and without any programming skills, just a few clicks.
Once configured your rules (what you want to scan), the market scanner automatically scans all symbols and all timeframes you wish in order to look for your rules. The scanning results can be shown as different colors in a table to understand the overall situation immediately. Columns are the timeframes, and rows are the symbols, so every cell is colored according to the rule for that timeframe and that symbol.
And not only this, it can send you an alert on your mobile phone when there is a change.
How does market scanner for moving average convergence divergence work?
We want to start analyzing a simple scanning situation, as we'll see this is enough for different situations.
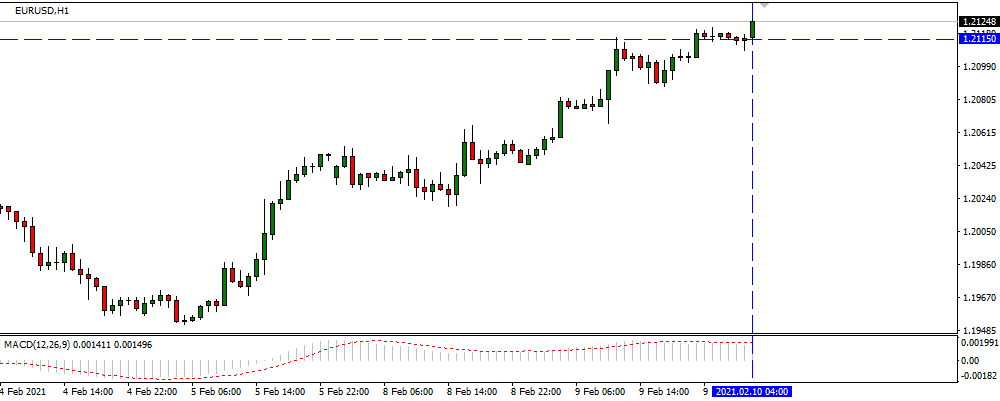
We start with moving average convergence divergence zero crossover, so we want to immediately see if the MACD and the signal line are below or above zero. The MACD zero crossover easily gives us a lot of information about the overall situation. So we could have the following colors:
- MACD > 0: Green, since we expect an uptrend
- MACD <= 0: Red, since we expect a downtrend
However, we also want to immediately see information about the signal line, having a MACD & Signal zero crossover so that we could have the following colors:
- Signal Line > 0: Green
- Signal Line <= 0: Red
To show both MACD values (MACD itself and signal line) in the scanner, we could use multiple color cells, which allow having more colors simultaneously in each cell.
So our scanner will look like the following one; of course, we use the standard parameters MACD(12,26,9).
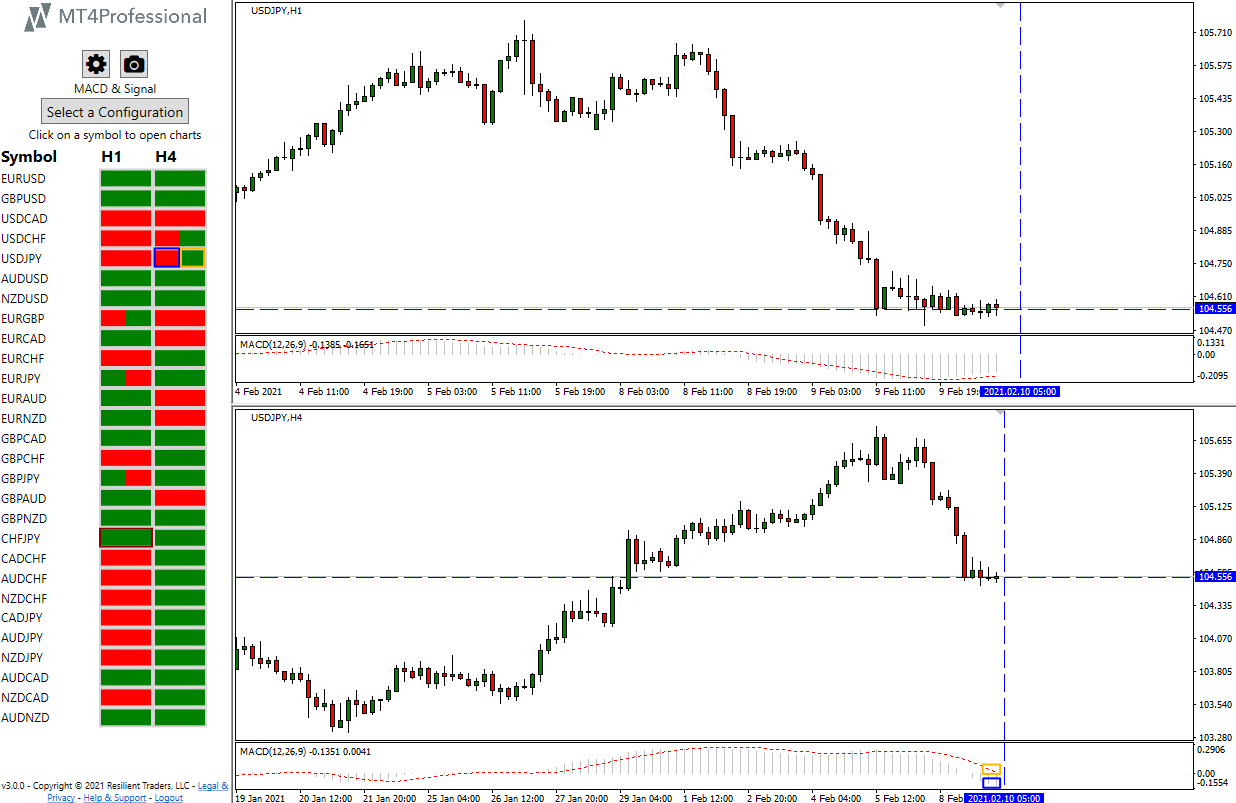
Looking at the previous image, we see for USDJPY H4, where we have MACD below zero and signal line above zero. The first part of the cell is colored red since it's referred to the MACD, while the second part is colored green since it's referred to the signal line.
How to configure the market scanner?
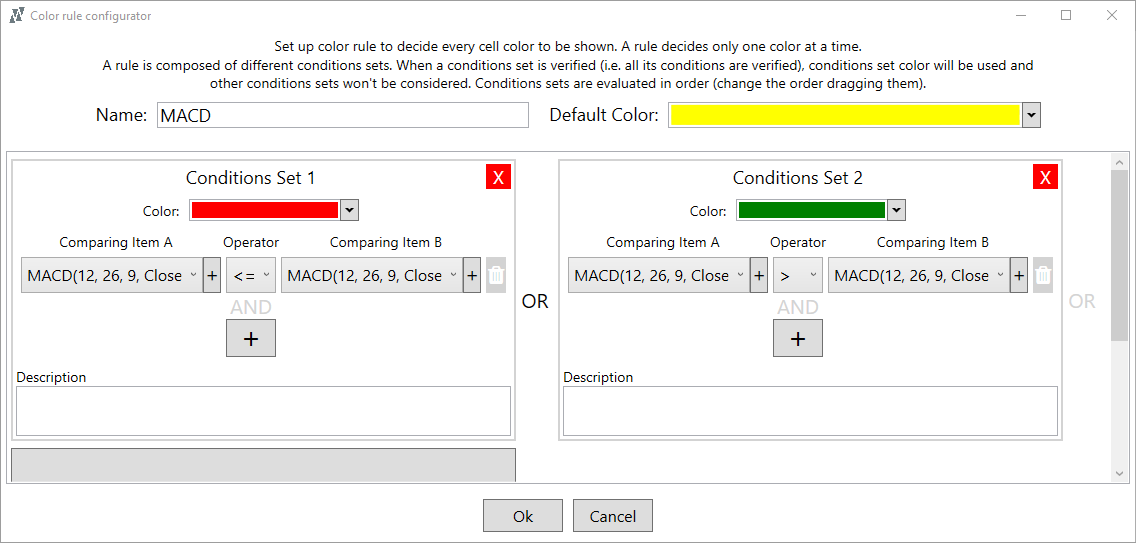
It's effortless, and we just put rules as previously described in words, setting the color we want to see. Since we want to see two different colors, we have to set the following two different rules:
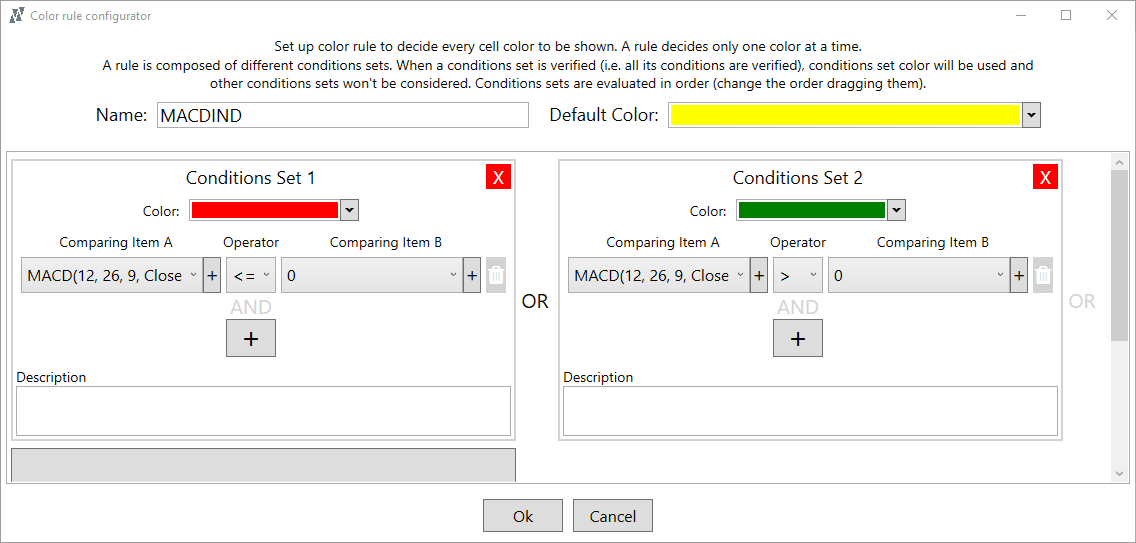
MACD
- If MACD > 0: green
- If MACD <= 0: red
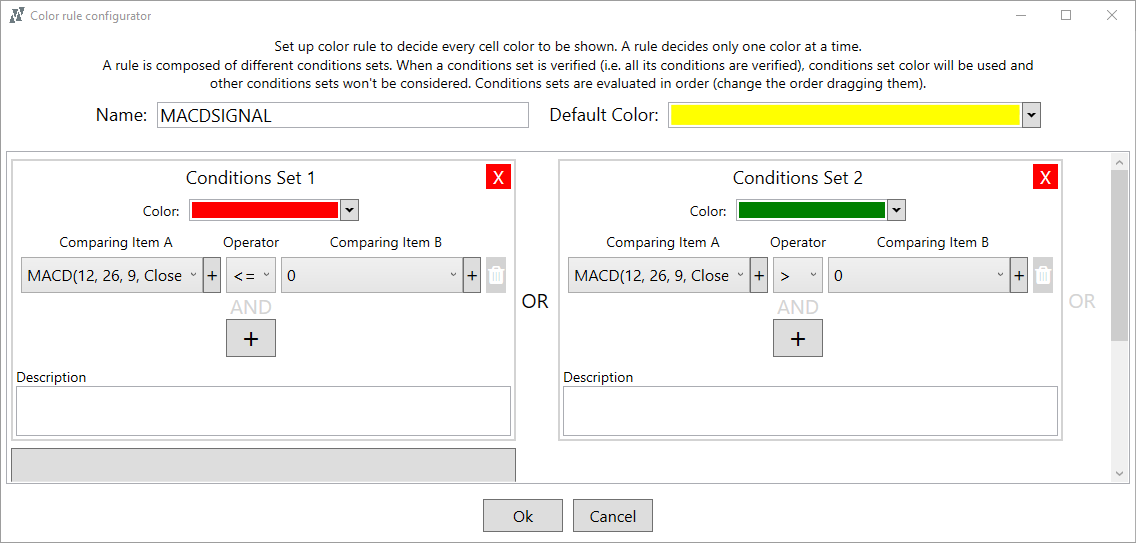
Signal Line
- If Signal Line > 0: green
- If Signal Line <= 0: red
We have to do only this, only specify our scanner rule, then the scanner automatically will apply this rule for symbols and timeframes defined.
Other moving average convergence divergence Strategies
We can see that the MACD & Signal zero crossover strategies can also quickly identify rapid MACD rises/falls. In fact, we can use the scanner to immediately know the situation in every pair checking the direction and checking when it changes, then refine the analysis by opening the chart and manually checking if the rises/falls are rapid or not.
While for moving average convergence divergence and signal crossover, we can use an analogous way we used in two SMA crossover.
So we want to have the following situation:
- MACD > Signal Line: green
- MACD <= Signal Line: red
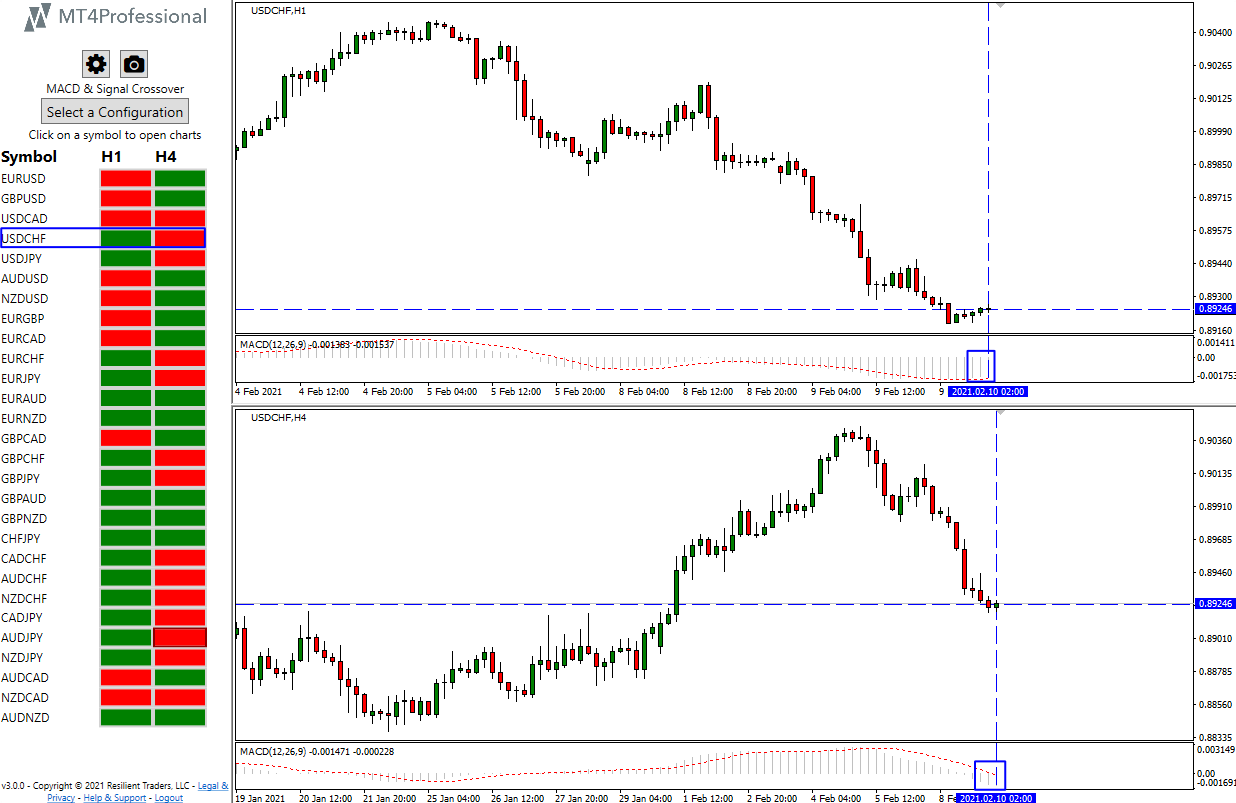
Looking at the previous image, we see for USDCHF, where we have MACD above signal line for H1 and vice-versa for H4. So according to the previous rules, the H1 cell is colored green and the H4 cell is colored red.
The scanner rules are trivial:
- If MACD > Signal Line: green
- If MACD <= Signal Line: red
Alerts Notifications
We previously said a market scanner allows you to send an alert on your mobile phone.
In moving average convergence divergence, having alerts notifications is useful in both configurations since you could be alerted when there is a cross.
The alerts allow you to immediately start analyzing the chart manually and with other instruments only when there is a high probability of trend reversal. And this without losing time before when this cannot occur.
Conclusion
We have seen how easy it is to scan the moving average convergence divergence using a market scanner.
However, some years ago, we looked for a market scanner on MT4/MT5, since we are traders, but we didn't find it. So we decided to create MT4Professional, the #1 Market Scanner on MT4.
MT4Professional has full market scanner capabilities with alerts notifications. Still, not only this, but it also has other useful features to help you refine opportunities identified via the scanner, such as open symbols charts in one click or multi-timeframe analysis via synced crosshair.
Do you want to start with the example shown before?
MT4Professional has many scanner examples included, and one of them is the basic MACD & Signal zero crossover example shown before.
If you want to start now to scan the moving average convergence divergence on MT4/MT5 you can try MT4Professional for FREE.